
MACD Stochastic Overlay is a specialized system designed to assess the current market position, as well as to identify optimal entry points to the market. On the chart, this indicator is represented as candles painted in certain colors, thanks to which the direction of the trade will be revealed. Despite the complexity of the calculations, the indicator MACD Stochastic Overlay is quite simple to use. To perform its main tasks, the indicator combines the calculations of two indicators MACD and Stochastic at once, which together create a win-win mini strategy that can be used on any timeframe, with any currency pairs.
Indicator parameters
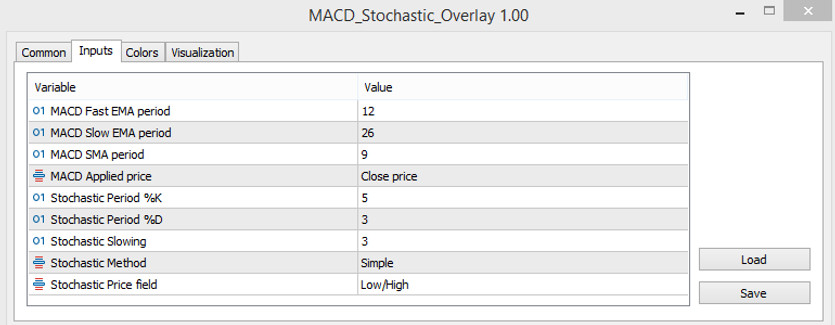
Since the MACD Stochastic Overlay indicator combines the calculations of two indicators at once, it is logical that its parameters will be compiled on their basis.
MACD
- -Fast EMA period-period for calculating the fast exponential moving average of the MACD indicator. The default value is 12.
- -Slow EMA period - the period of the slow exponential moving average MACD. The default value is 26.
- -SMA period - MACD simple moving average period. The default value is 9.
- -Applied price - the price to which the calculations of the MACD indicator will be applied. The default value is Close price.
Stochastic
- -Period %K-period of the fast curve of the Stochastic indicator. The default value is 5.
- -Period %D-value of the period of the slow curve. The default value is 3.
- -Slowing - slowing down the Stochastic indicator. The default value is 3.
- -Method-type of smoothing curves of the Stochastic indicator. The default value is Simple.
- -Price field-price over which Stochastic calculations will be made. The default value is Low/High
For ease of use, the MACD Stochastic Overlay indicator in the settings has the function of changing the color scheme of the candles displayed on the chart.
Indicator signals
After receiving certain conditions, namely after reproducing the calculations by the MACD and Stochastic indicators, a signal is generated to open certain positions. Since the MACD Stochastic Overlay indicator colors candles in one of several colors, changing their color will be its main signal. This algorithm is so simple that can be used even by beginners. Candles are drawn on the chart, which, depending on the current market situation, acquire a certain shade, so there are candles on the chart with a color that indicates growth, fall, closing and opening of a trade. Accordingly, if a color with a growth value is a signal for a buy trade, with a fall value - a sell trade, the remaining colors will help close the current trade. However, when auxiliary candles appear, trades should not be opened.
Signal for Buy trades:
- -On the chart, the current candle is colored with a growth value. This indicates the beginning of an uptrend in the market.
After receiving such a simple signal, a long position can be opened. It is logical that it should be closed after coloring a certain candle in a different shade, which will be characterized by the beginning of a downtrend or the absence of any trend.
Signal for Sell trades:
- -A downtrend is forming in the market, that is, the current candle is colored with a falling value.
After the formation of such a signal on a certain candle, a short position is opened, which should be closed after the formation of a candle with a different color.
Conclusion
The MACD Stochastic Overlay indicator is very good in its task, especially if it is used the indicator correctly, with all the trading conditions, then any trade can be made without loss, and even with a good profit. However, despite the ease of use of this algorithm, it should be practiced on a demo account .


