
Many traders are very familiar with the standard CCI tool, which is included in the MetaTrader terminal set of indicators. It helps determine the current trend in the market and indicates profitable entry points to trade. However, at the same time, his readings are often not enough to fully assess the schedule. In this regard, a modification of this tool was carried out. The new version was named Woodies CCI after its creator - Ken Wood.
This instrument, just like the classic CCI, determines the prevailing trend in the market. Based on the received data and found patterns, the indicator gives signals for opening deals and shows the market's optimal exit points. At the same time, it automatically searches for graphic patterns on the chart. Based on the received data and found patterns, the indicator gives signals for opening deals and shows the market's optimal exit points. The old CCI version has been significantly redesigned. For example, another moving line with a period of 6 was added to the indicator. It reacts much faster to fluctuations in quotations and can partially predict the change in a curve with a period of 20 (on large timeframes) or with a period of 14 (on small timeframes).
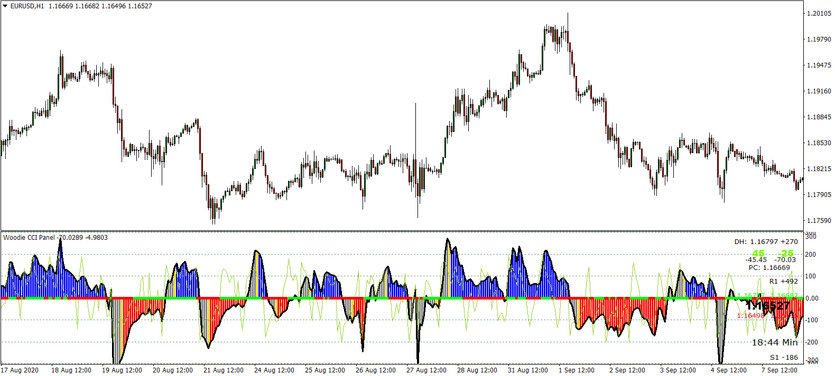
In addition, other changes have been made to the Woodie CCI indicator. For example, a histogram has been added to show the direction of the trend. If the histogram bars are blue, then there is a stable uptrend in the market, and if they are red, then the trend is a downtrend. Yellow bars are warning bars - they signal the change of an old trend to a new one. An example is shown in the picture above. Additional information about the trend can be obtained by the color of the zero levels of the indicator. If it is green, then the market is in a bullish trend, and if it is red, then the trend is bearish.
Indicator settings
The primary and most important parameters of the Woodie indicator are the TrendCCI_Period and EntryCCI_Period parameters:
Period of the TrendCCI line. By default, its value is equal to 14. CCI 1 - this is the black line of the indicator. On its basis Woodies will be built colored columns of a chart indicating the direction of the trend;
Period cool EntryCCI. Its value, by default, is equal to 6. This move is also called Turbo CCI or TCCI. This line will give warning signals, in parallel with this, predicting the direction of the CCI 1 move.
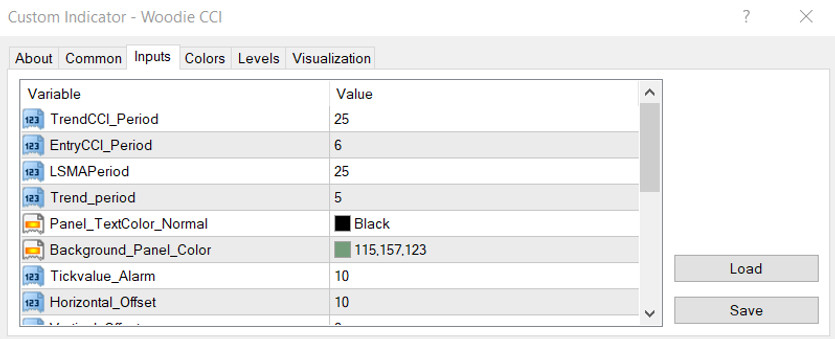
All other indicator parameters do not affect its calculations and serve as additional visual and audio settings.
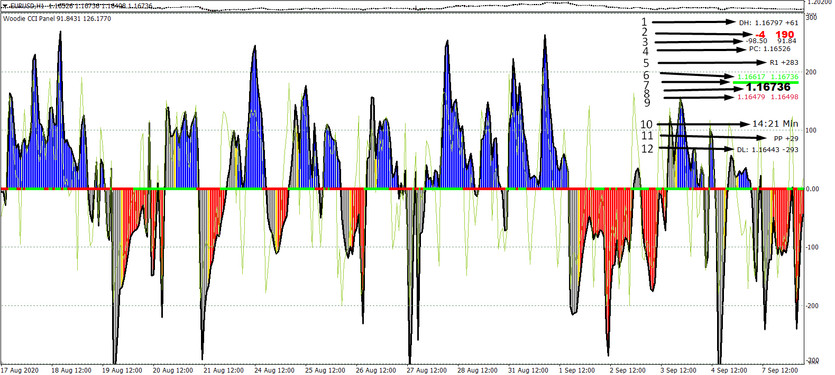
In addition to the indicators of the histogram and TurboCCI curve, the indicator has an information window on the right that is responsible for additional information, namely:
1 - day high and at what distance from it the chart is now.
2 - the delta between the current and previous Woodie's CCI bar (right number), the current, and the third one (left number) is indicated.
3 - CCI on the last two candles.
4 - at what price the current candlestick opened.
5 - the Pivot level (closest from the top), and its distance is signed.
6 - High price of the last two candles, the right number corresponds to the current candlestick, the left one - to the previous one.
7 - price value.
8 - Low price of the last two candles.
9 - in the picture above, this field is empty. The name of the Price Action pattern is displayed here when it is formed.
10 - how much is left before the candle closes.
11 - the nearest Pivot level is displayed here, as well as the distance in points to it.
12 - the minimum of the day and at what distance from it is the current candle's open price.
Indicator signals
In addition to the histogram's aforementioned color signals and the zero level, the Woodie CCI indicator is one of the few instruments that have their own entry patterns. These patterns were found by the author of the tool, Ken Wood, and added to the indicator settings. They work well on the chart and give accurate signals to enter the market.
Trend patterns:
1. Zero-line Reject - ZLR. This is one of the main patterns of the system. After the trend has been established, we look for a situation when the CCI chart is as close as possible to the zero lines (not reaching, or slightly going beyond the ZL). Usually, +/- 50 zones are a satisfying condition (some traders tighten the conditions to +/- 30). The CCI then reverses and thereby confirms the trend. This is where the entry point to the market is.
2. Reverse Divergence - Rev diver. As with all trend patterns, we first need to make sure that the trend is established. For a bullish trend, we look to see if there are peaks and troughs on the CCI charts that can be used to draw a trend line towards the zero-line. We need two peaks to draw a trend line. To draw it, you can use both CCI and TCCI. For a bearish trend, everything is mirrored. There must be an intersection of the main lines (+/- 100, ZL) and then the line we drew earlier to validate this pattern.
3. Trend Line Break - TLB. This pattern is very similar to the previous one. The main difference is that we are building a trend line not along small peaks or troughs within one wave, but along the tops of the waves themselves. This means that on the CCI chart, the peaks 1 and 2 (or troughs, for a bear market), along which the trend line is drawn, may (although they do not have to) intersperse with short ZL crossovers.
4. Horizontal Trend Line Break - HTLB. A horizontal trend line should appear inside the area 100. The rules for drawing a horizontal trend line are the same as in the case of the TLB pattern. CCI, crossing the horizontal line, gives a signal to open a position. This pattern is strengthened if it is based on more than two peaks.
Countertrend patterns:
1. The Famir pattern. This pattern is a rebound from the zero-line (ZLR), which turns out to be false on the next bar. In other words, CCI should bounce off the zero-line (it is allowed that CCI does not reach ZL a little or go a little behind it) and turn again towards ZL on the next bar.
2. Vegas Trade - VT. First, the CCI goes to the extremum in the direction of the current trend (up to +/- 200 or higher). Then it returns closer to ZL, at least to the +/- 100 zone. After that, the indicator line makes a smooth reversal in the trend direction for three or more bars. This reversal looks like a small, rounded depression or area. Then the CCI moves slightly in the direction of the trend and reverses again. A signal to trade in the fall of the indicator line below the previously indicated deepening.
3. Ghost Trade. This is a counter-trend pattern that gets its name because a ghost-like shape is drawn on the chart. In the classical view, this is a common "Head and Shoulders" figure. This pattern includes three trend peaks. The middle peak is higher than the first and last. A support line is built along two bottoms to the left and right of the middle peak. As soon as CCI, having made the third peak, breaks this line, a position should be opened.
4. Hook From Extreme - HFE. This pattern is the easiest to identify. As a counter-trend pattern, the HFE occurs when the CCI breaks out of +/- 200 and reverses towards the zero-line.
Conclusion
Woodie's CCI is a time-tested indicator. All you need to do to successfully trade Woodie CCI is to learn how to spot its patterns and work with them. It is better to start working with this indicator by mastering trend patterns since they are more profitable and give accurate signals for entering the market. After that, you can already proceed to trade on counter-trend signals. As a rule, such trades are riskier.


