

By RoboForex Analytical department
Fundamental analysis of USD/CAD
The Canadian dollar looks strong and definitely has a chance to become even stronger.
The Bank of Canada used to pursue the policy of low interest rates for almost 2 years, but in March 2022 it had to raise the rate to 0.50%. This was done, among other things, to control inflation. The CPI had been growing in Canada stably since May 2021, with just a small pause in June; by February 2022, it had reached 5.7%. This meant serious growth of prices. The CAD hardly reacted to the decision of the regulator: firstly, it was anticipated, and secondly, the economy can afford it.
The labour market looks quite balanced. The unemployment rate is declining gradually, reaching 5.5% in February. So, the economy can manage with somewhat tighter credit and monetary conditions as it gets supported by commodities.
The oil rally made the position of Canada even more beneficial. Brent costing $110-125 a barrel is very good news for he Canadian commodity economy. Commodity prices are growing confidently, stabilizing the national currency. Of curse, such a close link with commodity prices can have different effects on the economy, yet now the effect is desirable.
What looks somewhat risky is the growth of the return on US bonds. This can hinder the growth of the CAD.
Canada is to far away, both physically and politically, from what is going on in Europe and can improve its position internationally by stable supply of energy carriers. This will also support the CAD.
Tech analysis of USD/CAD
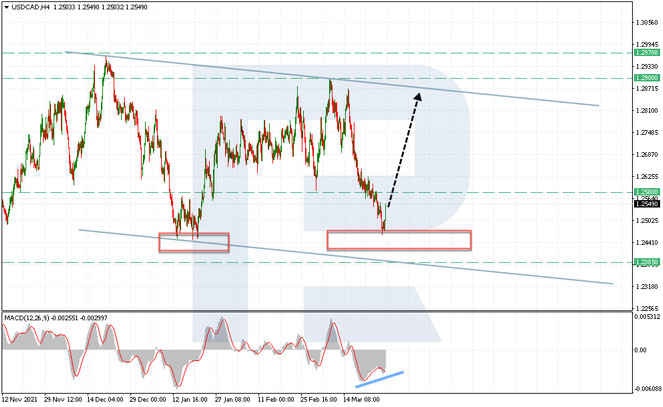
USD/CAD price is correcting by the Triangle pattern. The main scenario suggests a bounce off the lower border of the pattern and going towards the resistance area of 1.2900. At the end of last year, the pair already bounced off the support level of 1.2455 upwards, but the buyers still cannot manage with the important level of 1.2900. As can be seen on the chart, there has been 3 attempts of such a breakaway but in the end prices always drop to the resistance area. The growth from the lower border of the Triangle is supported by a bounce off the support line on the RSI. The values reversed near 30, thus having some room to go to 70, from where it may start correcting. And with a breakaway of 1.2900 the pattern will be complete, and the pair will start going by a new pattern with a goal at 1.3365.
On H4, the price confidently bounced off the support area. A bullish divergence is forming here on the MACD; in ranges, such patterns become very strong – until the indicator values cross zero. The aim of growth in this case will be the upper border of the descending channel. However, before beginning to grow, the price might test 1.2385, in the form of a bounce off the lower border of the channel. A breakaway of this border downwards, in turn, can provoke bearish pressure – in this case, the price can fall by the width of the channel. This negative scenario only becomes possible if the price secures under 1.2385.
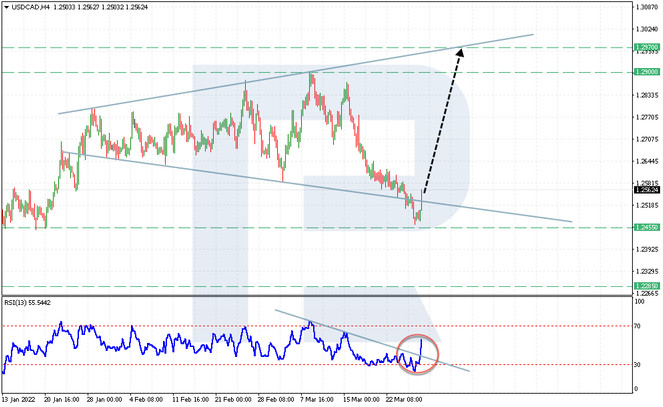
Looking at this TF in more detail, we may notice a Broadening Formation pattern not yet complete. Going by the pattern, the price bounces off the lower border of the pattern and proceeds to the upper one at 1.2970. A supporting signal for this movement is a breakaway of the descending resistance level on the RSI. Such a signal suggests a test of the same line on the price chart, which is now 1.2830. The pattern can be cancelled by a breakaway of 1.2455. In this case, the decline will aim at the area of 1.2285.
Closing thoughts
Summing up, we should definitely mention the Triangle pattern forming. In most cases, such a pattern means ambiguity in the pair until it escapes the pattern from any of the sides. A breakaway of this structure upwards will open a pathway for buyers to 1.3365. This scenario is supported by a bounce off the trendline on the RSI. However, the bulls need to keep the support level of 1.2455 safe from breakaways, making possible a test of 1.2900, i.e. the upper border of the Triangle.


