
Trading strategy represents an important part of trading and at the same time, it is one of the fundamental parts deciding in the future about the fact if traders are gong to continue in their efforts or they are going to finish their career as they will start to believe that trading is one “big scam,” what is often easier than to admit own failure.
So, to avoid hard times for new traders, we have prepared a demonstration how a long-term and functional strategy could look like.
Why do we use RSI along with moving average in the strategy today?
In the event we trade according to the RSI or only by the use of moving average, there are often situations on the market when the price quotes move sideways, causing in case of using multiple indicators that you could face numerous false trading signals, resulting in many trades in loss.
Therefore, the main reason why we combine these two great indicators in the strategy today is the fact that thanks to this, the number of false signals will drop on almost each market significantly.
On the other hand, the disadvantage here may be that besides the mentioned false signals, also some valid signals are about to be eliminated, however, at the end of the day, this tends to have significantly smaller adverse impacts on capital for trading as in the case when we use signals only from a single indicator.
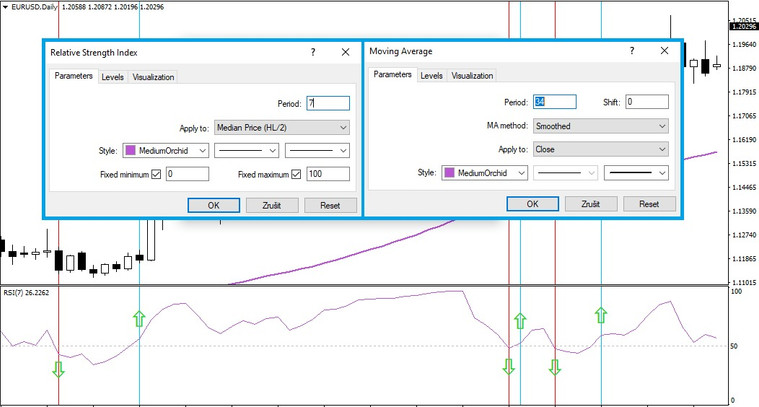
Setting up indicators
On the image above, we can see specific settings of the RSI (Relative Strength Index) and MA (Moving Average) indicators. In the event of RSI, it should be mentioned that in the strategy today, we won’t be using standardly used levels of 20,30,70,80, but we will keep the level of 50 for today and everything is going to happen within a D1-Daily time frame.
Strategy rules and entire process
The strategy from today is pretty easy. It’s important for the signal of moving average (price above average=signal to buy, price below average=signal to sell) to correspond with the RSI signal (RSI value passes through 50 from the bottom upwards=signal to buy, RSI value passes through 50 from the top to bottom=signal to sell) and if it happens, entries are executed. Conversely, in case signals are opposite, open positions are being closed.
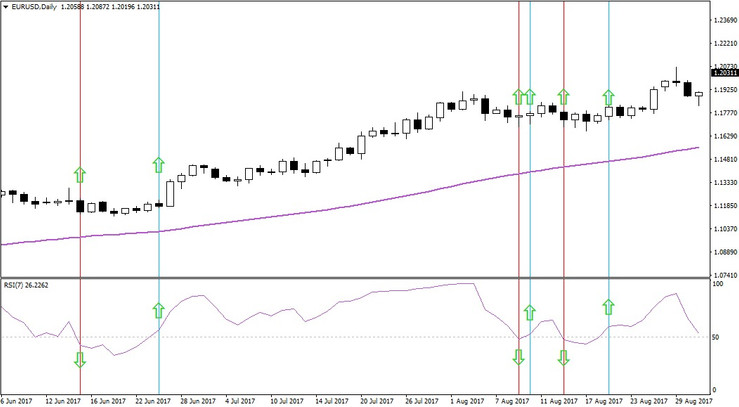
How we can see on the chart above, there are situations when the RSI value passed 50 level (displayed by vertical lines), representing a warning that trading positions may be open or closed. So, if we follow the chart over time (from the left to the right), firstly a situation occurred when the RSI value passed 50 level from the top to the bottom (indicator window – green arrow downwards), however, at the same time, the price of instrument moved above moving average, representing an opposite signal (chart window – green arrow upwards), therefore, no trade is to be open here at all (false signal=red vertical line).
Conversely, these are those situations where it’s not completely clear which direction the market is going to take, therefore, all trading positions may be potentially completely closed, previously opened within this strategy.
Then, the RSI value passed through the 50 level from the bottom upwards (signal to buy) and the price moved above moving average (signal to buy), meaning that a position was open here according to strategy (valid signal=blue vertical line).
Naturally, we could continue like this further, however, let’s move to the most interesting point – to the evaluation of potential trades.
Final evaluation of trades
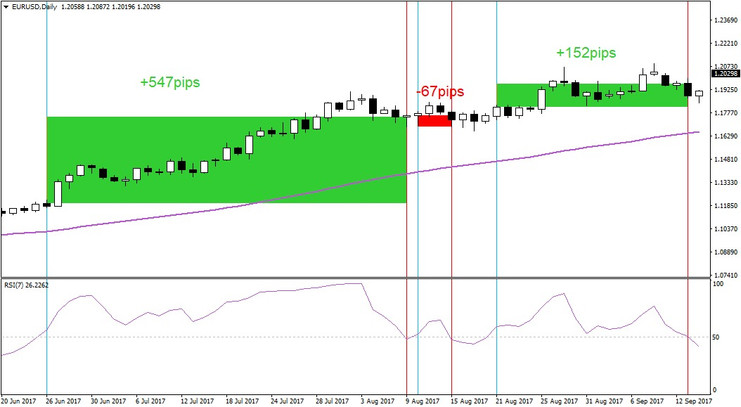
On the chart above, we may see how three trading positions in a row developed over time (this chart may be shifted by 10 days forward compared to the previous one) while in first case, it was possible to achieve a profit of even 547pips. However, what’s more important from the perspective of this demonstration, is the second trade, ending with a loss of 67 pips. Here, we have to understand that even in case the trade was open according to the rules, market simply did not follow the expectations (that is something generally related to trading and such trades may occur even multiple times in a row) and we need to count on that all the time.
However, in general, this strategy tends to bring a potential of much bigger trades in profit than the trades with a loss, thanks to which, usually, only a single trade in profit is enough to cover the loss of few trades with losses.
Small notification at the end: Please, take into account that the demonstration of specific settings of both indicators today serves only as a representative example and not as a clear guide. Optimal settings may change not only depending on the market, but also in the trading approach, therefore, each trader must choose its optimal settings of both indicators on its own.
If you would like to try out trading with top tier trading conditions and professional forex broker, don’t hesitate to try our demo account that may be open on our website completely for free and free of any risk: www.purple-trading.com
We wish you many profitable trades!
Purple Trading team
info@purple-trading.com


