
By RoboForex Analytical Department
Fundamental analysis of USD/JPY
The world is bound by tight trade and economic links, and any malfunction here can ruin lots of things. So, this is how Japan got into more trouble: apart from threatening inflation, it gets stressed out by the international situation. The latest CPI reached 0.9% y/y, which is good. However, the goal of the Bank of Japan is 2%, and it might take long months to reach it.
There is just one detail, which is critical growth of prices for energy carriers and food worldwide. Japan feels this growth the same way as any other country. It is expected that by April and onwards the CPI will have reached about 2% y/y. The question is, whether the momentum is stable enough.
If inflation remains stable, the Bank of Japan will be able to run to cutting down on economic stimulation. The interest rate is at -0.1% y/y. There are no signals yet that the regulator is going to change it. However, such changes would become a bright indication of the inflation problem being close to some solution.
The outer situation has to do with the import of energy carriers and the export of gadgets and technology, electronics, cars. This is the result of the global geopolitical tension. However, Japan has to deal with these problems fast to avoid cutting down on industrial production and thus compromising the labour market.
The yen now does not enjoy much demand as a safe-haven asset because the US dollar is advancing too fast.
Tech analysis of USD/JPY
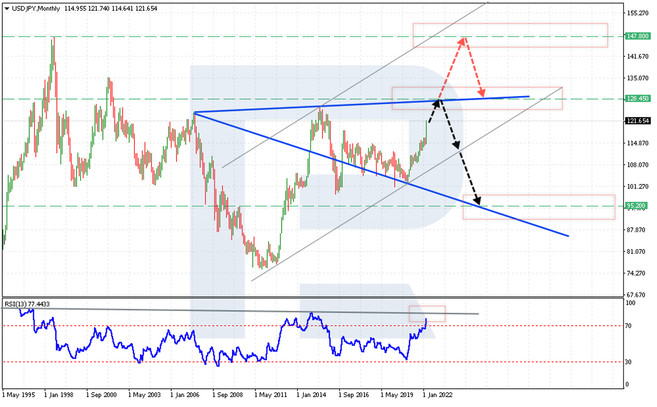
The USD/JPY currency pair is moving by a strong bullish momentum. On MN, the quotes broke through the upper border of a Triangle pattern, while the goal of going by the pattern is 133.95. Technically speaking, this movement was provoked by the escape from the long-term channel. However, to reach this goal, the buyers need to break through the local high of the end of 2014 and secure above 125.75. However, if the price bounces off this level downwards, a correction to 120.00 and 114.90 might develop.
Looking on the MN chart closer, one would notice a descending Wolfe Waves pattern forming. In most cases, the price bounces off the upper border of the pattern, or 128.45 in this case. However, the timeframe is large, and the price can easily rise higher, and with regard to the next resistance level it can reach 147.80. Still, the very forming of this pattern suggests falling from 128.45 with a probable goal of 95.20. An additional signal confirming this scenario can become a bounce off the resistance line on the RSI oscillator. The decline of the pair that started in 2014 also began with the indicator values rising above 70, and now the oscillator is behaving similarly. So, a strong resistance level in the way of growth can be 128.45.
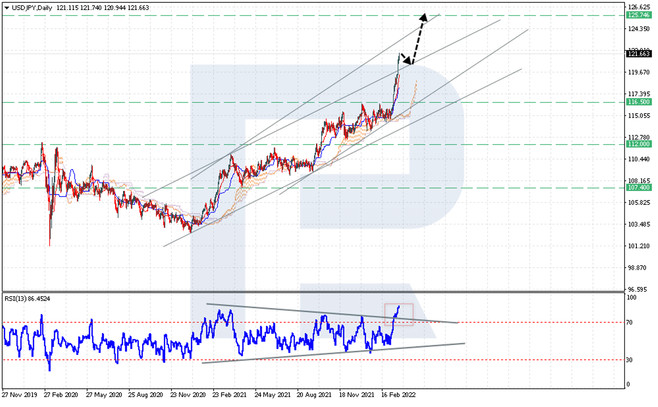
On D1, the pair is going inside the ascending channel. Note that just recently, the quotes have broken through the upper border of one of the long-term channels, which means the bullish trend is speeding up. Moreover, the RSI has broken through the upper border of the Triangle pattern. In such circumstances, the pair can return to the broken border of the pattern and further growth with the next goal of 125.75. The buyers can only be stopped by a return of the quotes under 116.50: then it will be clear that the price has stopped reaching new highs, and the buyers have lost energy.
Bottom line
Summing this up, it should be said that the pair is going inside the strong ascending momentum, the reason for it being a breakaway of a Triangle pattern on MN. The nearest resistance areas where the bulls can face serious resistance, are 125.75 and 128.45. However, there are signals of a possible decline because there is a large bearish pattern Wolfe Wave forming. In the long run, it can send the pair under 95.00.