
The Bollinger Bands indicator is a classic technical analysis tool found in every forex trading platform. Similarly, candlestick charts are also found in every forex trading platform and typically, the default chart type welcoming you when you launch the application. This guide explores a trading strategy utilising these well-known tools accessible to any forex trader.
Introduction to Bollinger Bands and Candlesticks
Bollinger Bands are a reliable indicator for understanding market volatility, which helps determine potential overbought or oversold situations, market tops & bottoms and market consolidation & breakouts. However, the indicator is based on a 20-period simple moving average, making it a lagging indicator. Therefore, any information you extrapolate from the indicator is up to 20-periods old.
Bollinger Bands on their own do not provide enough information to develop a trading system around; therefore, it’s necessary to combine them with another indicator, notably a leading indicator.
When conducting market analysis, there is no data more relevant than the recent and current prices. Candlesticks are printed based on the open, high, low and close price of a given period. Prices move because of supply and demand forces, and it’s traders who produce the supply and demand. Candlestick patterns can tell us a lot about market behaviour, and the information can be as recent as 1-minute old, depending on timeframe settings.
Bollinger Bands and Candlestick Trading Signals
The first step to implementing any trading strategy is to know how to extrapolate trading signals for the indicators. Essentially, this trading strategy combines the basic principles of using Bollinger Bands and candlestick patterns.
When the price, or candle, breaches either the upper or lower band, it suggests overbought or oversold conditions are approaching, and the trend may exhaust, or the price may rebound. When the upper and lower bands contract, it indicates low volatility and that when volatility increases, it is likely to result in a breakout. When the bands widen, it indicates greater volatility, which will ultimately settle down, and the market will begin to range.
Based on these Bollinger Bands principles, we can utilise candlestick patterns such as engulfing, hammer and morning star patterns to time and direct our trades. We can more accurately predict when trends will start and stop and the direction of breakouts using reversal patterns.
Engulfing candle set up
An engulfing candle is a reversal pattern, and it can be incredibly valuable for indicating the direction and timing of a breakout. In the example below, a bearish trend has exhausted, indicated by the moving average levelling off. Volatility also falls, shown by the contracted bands. The presence of a bullish engulfing candlestick is significant because it indicates that buying pressure exceeds selling pressure, hinting that as volatility increases, the breakout will be bullish; that’s exactly what happens in this example.
Hammer candle set up
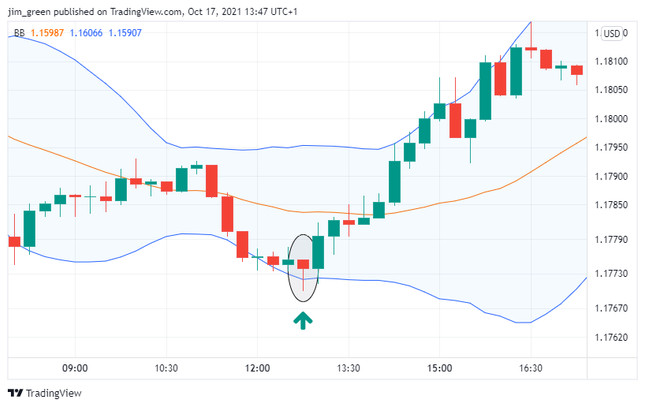
The hammer candlestick pattern is another reversal pattern. In the example below, you can see that towards the end of a bearish trend, a hammer candle breaching the lower band is formed as the simple moving average levels off. This scenario indicates buying pressure is greater than selling pressure. Subsequently, a bullish trend breaks out.
Morning star candle
The morning star candle indicates when a bearish trend ends and flips to a bullish one; it consists of three candles. The first candle indicates moderate to high selling pressure. The middle candle, typically a short-bodied candle, such as a Doji, suggests that neither buyers nor sellers are the dominant force. The third candle is bullish and implies demand from buyers, signalling the emergence of a bullish trend.
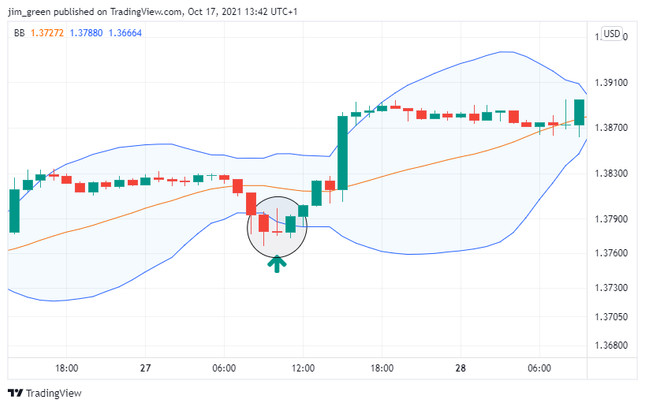
In the example below, you can see the morning star pattern presents after a few bearish candles and breaches the lower band during a contraction. The first bullish candle is followed by two others and then a large bullish move.
Bollinger Bands and Candlestick Trading Rules
Now you know when to enter trades, the next step is to understand when to exit. The best exit strategy aims to maximise gains as closing too early or too late can reduce profits.
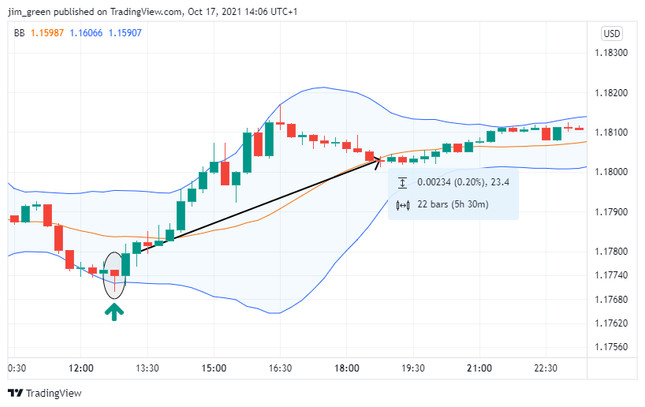
Although you can use your own money management rules to determine when to exit trades, a good exit strategy when using Bollinger Bands with candlesticks is to use the simple moving average as an exit point. If we refer back to our hammer example, suppose we opened the position following the bullish candle following the hammer and closed once the price crossed below the moving average. In that case, the profit would have been 23.4 pips or 0.2%.
Conclusion
Besides the three candlestick patterns described in the guide, you could use any candlestick pattern to complement the Bollinger Band indicator. The advantage of using candlestick patterns is to react faster to breakouts and reversals. Relying exclusively on Bollinger Bands can lead to many missed opportunities.


