
The Average True Range is a volatility indicator that measures the rate of change in the price in a market. If you are familiar with other volatility indicators like Bollinger Bands or Keltner Channels, you know that the upper and lower bands spread out when volatility is high and the bands contract together when volatility is low.
In contrast to these, the Average True Range indicator provides a value that tells us whether volatility is high or low. But we can see the same patterns of volatility that we would see with Bollinger Bands or Keltner Channels. The ATR captures what kind of price fluctuation can be expected for any given period.
How To Trade With The Average True Range Indicator
The most powerful way to use the ATR is to use it to identify spots in the market where the volatility has changed. This is a sign that a big move is underway. The ATR should not be used by itself to determine whether to buy or sell. It is simply a tool to be used alongside other indicators to give you a better sense of what is happening in any given market. The average true range indicator does not provide a direction. It simply measures the rate of change in price over the course of the specified period.
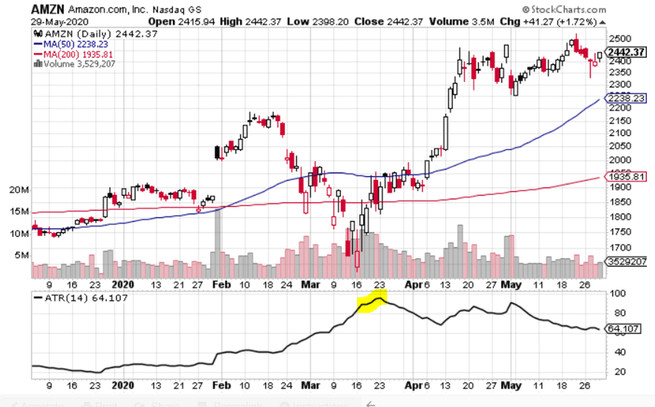
Consider the chart of AMZN below. The highlighted portion of the ATR indicator shows a peak, a high that goes back several months at least. This tells us that something big has happened to the price of AMZN. Of course, we can see that it went up, but the Average True Range gives us the significance of the price move based on a relative basis. Shortly after that price jump, the stock went through about a week of sideways battle between buyers and sellers. As you can see, the buyers eventually won.
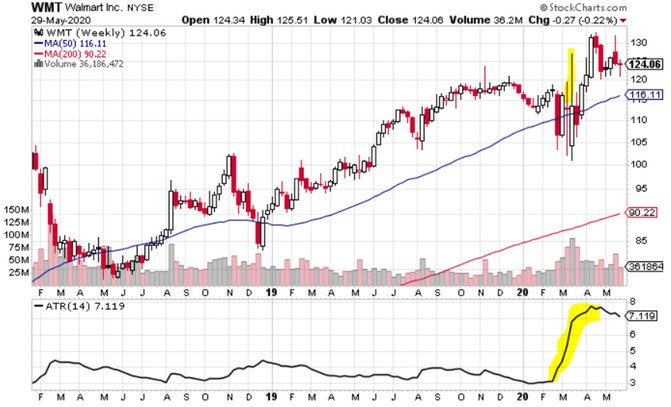
Consider this weekly chart of Walmart Inc. (NYSE:WMT). In the midst of the coronavirus pandemic, the bears who were worried about the pandemic fought against the bulls comforted by Walmart’s ability to stay open and provide essentials like food to its customers. Check out the long upper tail on the highlighted candle. That wick represents a swing of almost 10% of the stock’s value in a week that bears were able to take from the bulls.
Calculating Stop Losses With ATR
Since the Average True Range tells us what range of price movement we can expect from any given period of time, the indicator is very useful for setting stop losses. If the price of a stock goes down by more than the average true range, then it means that we have experienced a larger than average move against our position and we should consider the fact that we might be wrong and set our stop loss there so we can get out of the losing trade.
Conclusion
The ATR is a useful tool for identifying when the price is on the move. It should not be used by itself. The direction of the trend must be confirmed either visually or through other indicators like moving averages or the MACD.


