

In many cases, indicators have become an integral part of everyday trading, which is why most modern traders can't live without them.
While the Zig Zag is not an indicator as frequently seen as, for example, moving averages, but this is exactly where its unique strength lies. Today, it is the real little things that can divide traders into winners and losers, and the unique Zig Zag indicator really is just one such little thing.
Today's two forms of Zig Zag based strategies are not only extremely effective when it comes to trading, but on top of that they are so simple to understand that anyone can learn to trade with them.
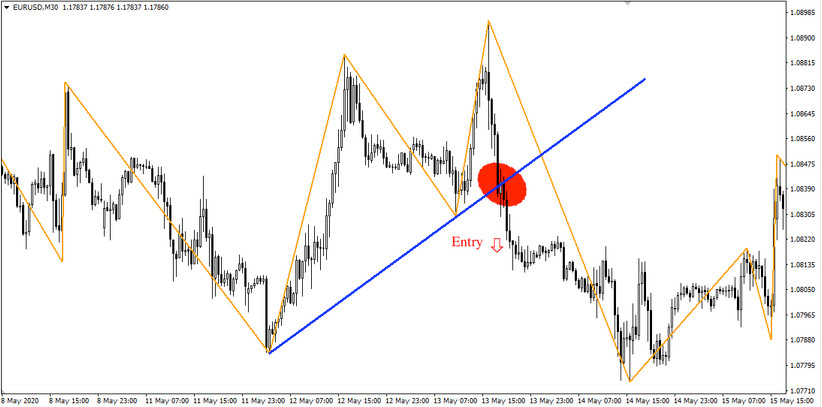
The first form of the Zig Zag strategy. In the picture below you can see a simple form of the Zig Zag strategy, where the base of this strategy consists of either two consecutive peaks (the 1st peak is higher than the second) or, on the contrary, two consecutive bottoms (the 1st bottom is lower than the second - see the chart below). When these two points are connected, a so-called trend line is drawn (blue line on the chart) and the moment it is broken (red point), the entry into the trading position is made.
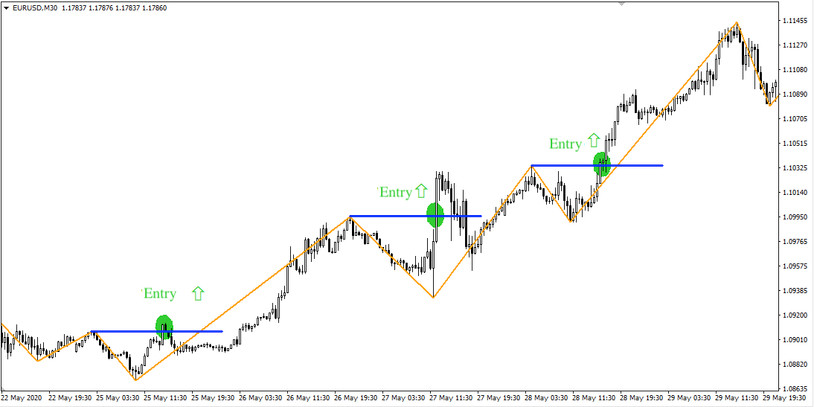
In the second form of the Zig Zag strategy, S/R levels are plotted instead of the trend line (see chart below) and if the price subsequently hits the S/R level, then trading positions are entered. As for the direction of entries, it depends purely on the trading approach whether the trader will take the hitting of the S/R level as a signal to sell, or as in our case below a signal to buy.
Our today's strategy performs best in markets that experience high oscillations in trends, that is, markets with significantly shorter trend alternations. If the markets exhibit just such conditions, then typically the success rate of the Zig Zag strategy does not fall below 70%, something that many other strategies can often only dream of.


