USD Weekly Fundamental Outlook: Upside Inflation Surprise & Risk-Off Wave Keep the Dollar Bid
The upside surprise in CPI inflation last week unleashed a new wave of USD bullish momentum and eventually took the DXY dollar index to a fresh cycle high, touching the 105.00 level. A risk-off episode in global stock markets additionally helped to fuel USD strength, especially vs the risk-sensitive currencies (AUD, NZD, CAD). Interestingly, other safe-havens like the yen also benefited, which was an outperformer on this risk aversion episode after a prolonged period of weakness (more in the JPY section below).
Last Wednesday’s hot inflation print will keep the Fed on course to tighten policy aggressively in the coming months. Market pricing of future Fed hikes suggests at least two more 50bp rate increases in June and July will come, and possibly also in September (taking US interest rates to 2% in summer already and 2.5% by September). Adding to this quantitative tightening (QT), which should commence on June 1, the overall bullish underpinnings for the US dollar remain intact. A slight risk-off tone and a weakening Chinese economy due to Covid lockdowns are only acting as additional tailwinds for the strong dollar in this environment.
The US economic calendar is relatively quiet this week, with only the retail sales report in the main focus. Housing data will also be watched, as will the Empire State and Philly Fed manufacturing indexes, which are leading indicators for this sector of the economy.
Aside from a possible short-term consolidation, perhaps driven by technical factors or some weakness in this week’s economic data, the USD bull trend should remain intact.
EUR Weekly Fundamental Outlook: EURUSD Could Reach Parity Soon
With no good news on the war in Ukraine, the euro was pressed down again last week. The news that Russia has cut off part of the gas supplies to Germany again sparked fears that a full embargo is a real possibility. Such a scenario could see the EUR currency accelerating its slide broadly.
It seems that the euro needs a significant de-escalation with Russia before a notable recovery of recent losses can emerge. Unfortunately, such a scenario of either a de-escalation of the war in Ukraine or the Russia-West relations still looks highly unlikely. This is why the outlook for the EUR currency remains negative, while EURUSD looks poised to test the parity zone (1.00) or lower.
On this week’s calendar, traders will watch ECB speakers, including Chief economist Lane and President Lagarde. Still, despite their hawkish comments and the market expectations for almost three ECB rate hikes, the euro has failed to benefit so far.
EURUSD Technical Analysis:
EURUSD broke the bear flag consolidative formation and extended a new leg to the downside last week. And while the overall bearish momentum is strong and the downtrend intact, further continuation lower at the same pace seems harder to come by going forward.
For instance, the daily RSI has hit oversold levels of around 30 again, which is accompanied by bullish divergence (see chart). While this is not a signal to go long, it does highlight the potential for some consolidation/retracement to happen. Additionally, EURUSD has also reached the lower trendline of the downward channel, suggesting technical support could help to attract some buyers here.
The nearest resistance to the upside is now located at the 1.05 zone, which was support till it broke. Above it, the focus remains on the 1.07 - 1.08 zone that should keep this downtrend intact. With EURUSD testing the lower end of the channel, while the RSI is oversold, a potentially sharp squeeze higher cannot be ruled out. Such a scenario could see this 1.07 - 1.08 resistance zone getting tested.
The other scenario is if EURUSD would fall to 1.00 (parity) from here without a notable consolidation first. In this case, a break below the support at the 1.0340 low would indicate this scenario is unfolding. An acceleration of the bearish price action could then see EURUSD quickly falling to the 1.00 area.
GBP Weekly Fundamental Outlook: Watching Economic Data on the Calendar
Following the Bank of England induced sell-off, the pace of losses has moderated somewhat and selected GBP pairs consolidated or even appreciated. Still, the currency remains very weak and is at risk of further losses if actual economic data starts to decline materially, as has been highlighted by the BOE at their latest meeting.
Last week’s consolidation in GBPUSD and EURGBP perhaps comes in anticipation of this week’s busy economic calendar schedule. The focus will be on the employment reports tomorrow (Tue), CPI inflation (Wed) and retail sales (Fri). This data could further highlight the high inflation – low growth risks to the UK economy. If this is the case, GBP will likely remain weak, and losses vs USD and EUR could extend.
In particular, negative surprises in the jobs and retail sales data could leave GBP vulnerable to a deeper sell-off. Inflation, on the other hand, is forecasted to climb to 9.1%, but this is widely expected, meaning that the market reaction could be more muted. However, a big deviation from this 9.1% forecast could as well see a big reaction to this report too.
Traders should also keep in mind that the pound is heavily oversold, and that is one aspect that could help the currency. On a longer-term horizon, however, the bearish trend remains solidly intact here, mainly driven by the weakening economy and the now dovish-leaning Bank of England.
GBPUSD Technical Analysis:
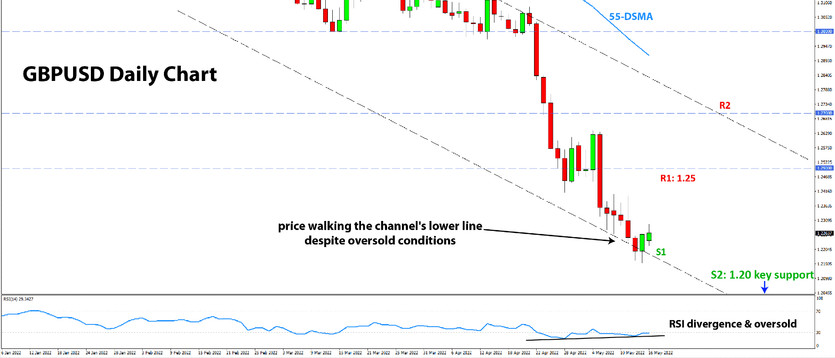
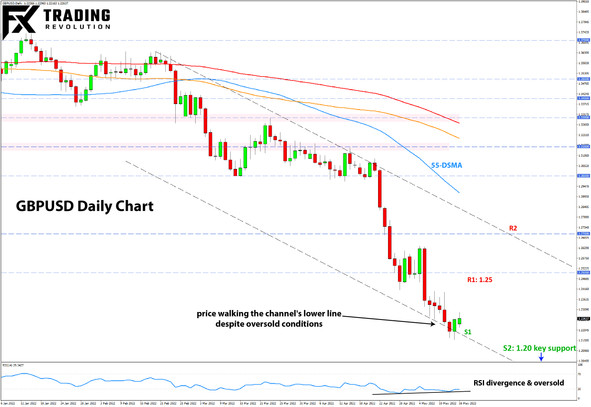
The pace of the decline in GBPUSD has moderated, though the pair still fell to fresh cycle lows last week. The bullish divergence on the RSI and other indicators has thus remained in place, indicating the diminishing bearish momentum of this latest down leg.
Yet, oversold conditions and bullish divergence by themselves don’t mean that the trend can’t continue for a while more. Thus, there is a clear risk that GBPUSD can reach 1.20, perhaps as soon as this week. However, the signals on the RSI do mean that we should be watchful for bullish signs. If a bullish signal appears, it would likely mark at least a temporary low and the start of a retracement. This could potentially be a reversal trading opportunity for contrarian traders.
Resistance to the upside remains at the 1.25 area, which would likely be reached if a retracement starts. Above it, the 1.27 zone guards the current downtrend and should provide strong resistance if it is tested.
Support seems to be forming around the 1.22 zone, though it seems of little significance. The crucial support for GBPUSD is, of course, at that 1.20 technical area.
.
JPY Weekly Fundamental Outlook: Beaten Down Yen Finally Rebounds
The yen rebounded strongly on Thursday and was actually the best-performing currency last week. The trigger behind the moves was the worsening of the sell-off in global equity indices, which this time was accompanied by falling US Treasury yields. Most of the declines in stocks so far this year were coupled with rising yields, which kept the bearish pressures on the JPY currency.
The key question for JPY traders now is, have US Treasury yields topped, or is there more upside in store? Judging by the relentless rise so far this year, it’s hard to say that a sharp reversal lower in yields could come soon. The same can be said about the yen. The bearish JPY momentum is strong, and a full reversal is unlikely to come quickly.
Still, for USDJPY to remain on its uptrend, US Treasury yields will probably need to climb further. The beginning of the Fed’s quantitative tightening (QT) program next month suggests that upward pressures on bond yields will remain. This, combined with a dovish BOJ that still keeps Japanese bond yields at 0%, should also keep bullish pressures on USDJPY intact. Thus, USDJPY testing the 135.00 zone still looks like a probable scenario for the coming weeks.
USDJPY Technical Analysis:
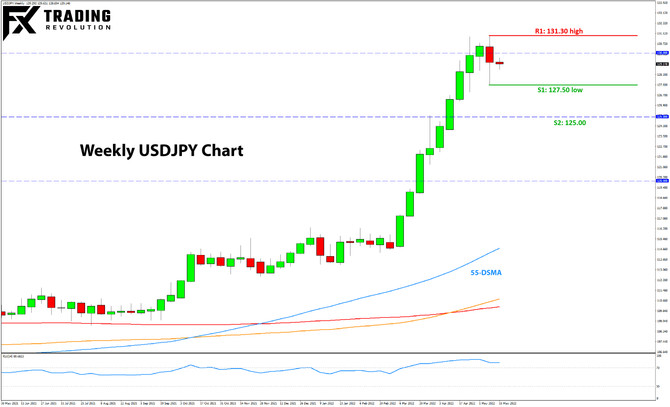
The weekly USDJPY chart is interesting, particularly how the price reacted after reaching the 130.00 zone. Last week’s candle formed a bearish engulfing pattern; however, it closed significantly off the lows. This is a mixed signal and could mean that prolonged consolidation is ahead for USDJPY.
From this perspective, the low of this engulfing candle is important to watch. If USDJPY breaks below it, it could result in bearish acceleration as not many support levels lie to the downside. The next one is the 125.00 area.
On the other hand, a new move above 130.00 that sticks could mean the uptrend is ready to resume. In this case, resistance could exist at each of the round numbers higher, ahead of the key 135.00 resistance area.