Today, and for the third week in a row, Brent crude is traded in a range, in the zone of strong support level 62.70 (EMA50 on the daily chart) and resistance levels 63.63 (EMA200 on the 1-hour chart) and 63.92 (EMA200 on the 4-hour chart).
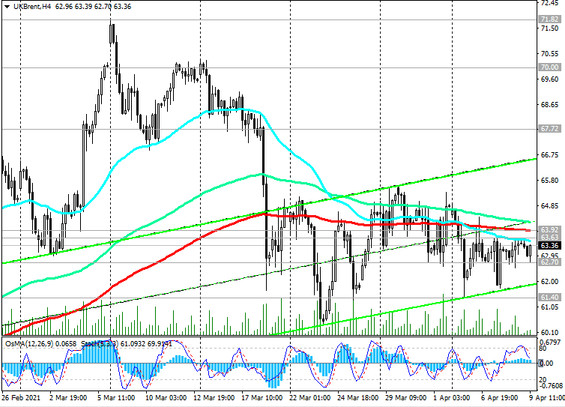
The technical picture at the moment looks contradictory. The price still maintains positive dynamics, moving in the ascending channels on the daily and weekly charts.
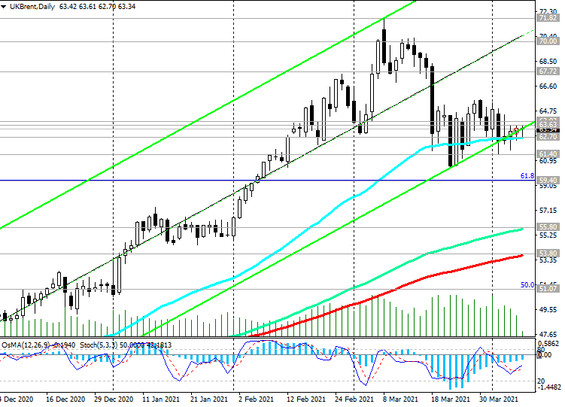
However, in the event of a breakdown of the support level of 62.70, the decline may continue to the levels of 61.40 (local lows), 59.40 (Fibonacci level 61.8% of the correction to the wave of the collapse of prices in October 2018 to almost absolute minimums at 15.55 in April 2020).
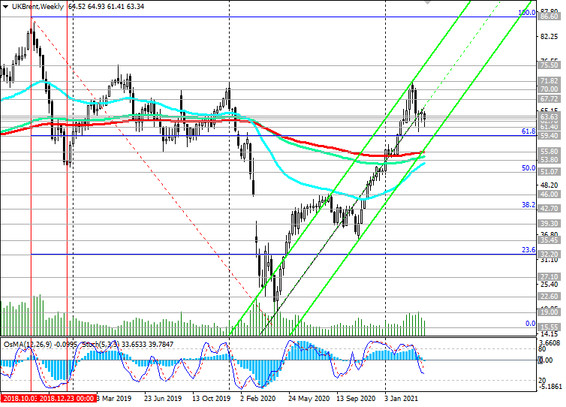
Breakdown of support levels 55.80 (ЕМА200 on the weekly chart and ЕМА144 on the daily chart), 53.80 (ЕМА200 on the daily chart) will increase the negative dynamics and the likelihood of a return into the downtrend.
In the main scenario, the price will break the local resistance level 65.56 and continue to rise towards the local and 14-month high 71.82. The first signal for the implementation of this scenario will be a breakdown of the resistance level 63.92.
Support levels: 62.70, 61.40, 60.00, 59.40, 55.80, 53.80, 51.07
Resistance levels: 63.63, 63.92, 65.56, 67.72, 70.00, 71.82, 75.50, 86.60
Trading recommendations
Sell Stop 61.30. Stop-Loss 65.60. Take-Profit 61.00, 60.00, 59.40, 55.80, 53.80, 51.07
Buy Stop 65.60. Stop-Loss 61.30. Take-Profit 67.72, 70.00, 71.82, 75.50, 86.60