
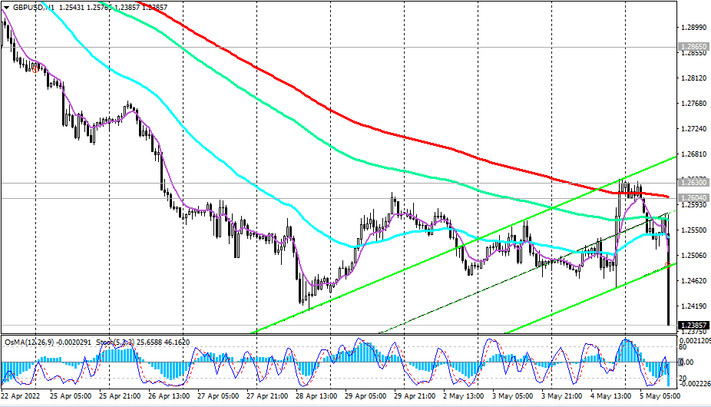
As we noted above, “the pound weakened sharply, and the GBP/USD pair fell after the Bank of England published a decision following the results of its regular meeting that ended today.”
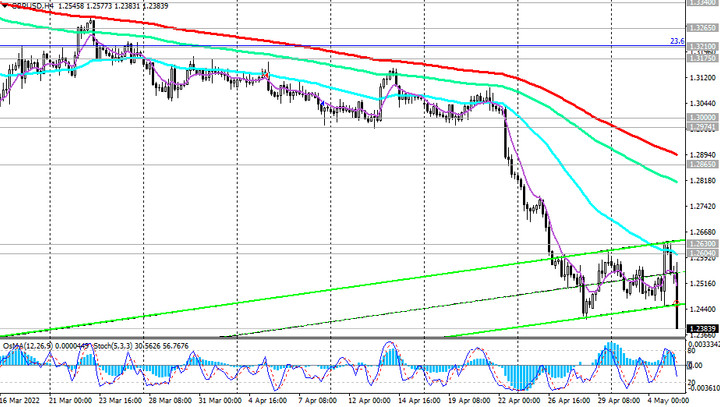
At the time of this article's publication, the GBP/USD was near 1.2385, 237 pips below today's opening price.
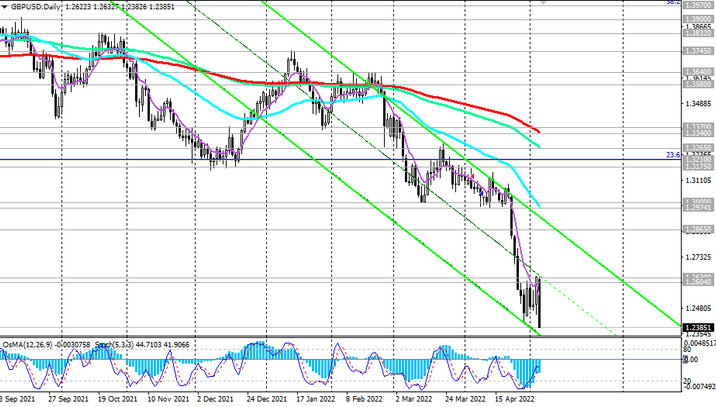
Last week, the price broke through the lower limit of the descending channel on the weekly GBP/USD chart, and today the movement is accelerating towards the lower limit of the descending channel on the daily chart, passing through 1.2340.
Its breakdown may accelerate the decline towards the local support levels 1.2250, 1.2085, 1.2000.
In an alternative scenario, and after a breakdown of the local resistance level 1.2630, GBP/USD will resume growth. The target of this upward correction may be resistance levels 1.2865 (upper limit of the descending channel on the daily chart), 1.2975 (EMA50 on the daily chart), 1.3000 (local resistance level).
However, only growth into the zone above resistance levels 1.3340 (EМА200 on the daily chart), 1.3370 (EМА200 on the weekly chart) can turn the tide, increasing the likelihood of GBP/USD growth into the zone of a long-term bull market above the key resistance level 1.4580 (EМА200 on the monthly chart and Fibonacci level 50% of the correction to the GBP/USD decline in the wave that began in July 2014 near the level 1.7200).
Support levels: 1.2300, 1.22250, 1.2085, 1.2000
Resistance levels: 1.2604, 1.2630, 1.2865, 1.2975, 1.3000, 1.3175, 1.3265, 1.3340, 1.3370
Trading recommendations
Sell by market. Stop Loss 1.2580. Take-Profit 1.2300, 1.22250, 1.2085, 1.2000
Buy Stop 1.2580. Stop Loss 1.2460. Take-Profit 1.2604, 1.2630, 1.2865, 1.2975, 1.3000, 1.3175, 1.3265, 1.3340, 1.3370